RIS Productivity Gap Analysis Toolkit
FIND WHERE PRODUCTIVITY IS ACTUALLY BEING LOST.
TURN SHIFT DATA, DELAYS AND OUTPUT INTO A CLEARER PICTURE OF OPERATIONAL PERFORMANCE.
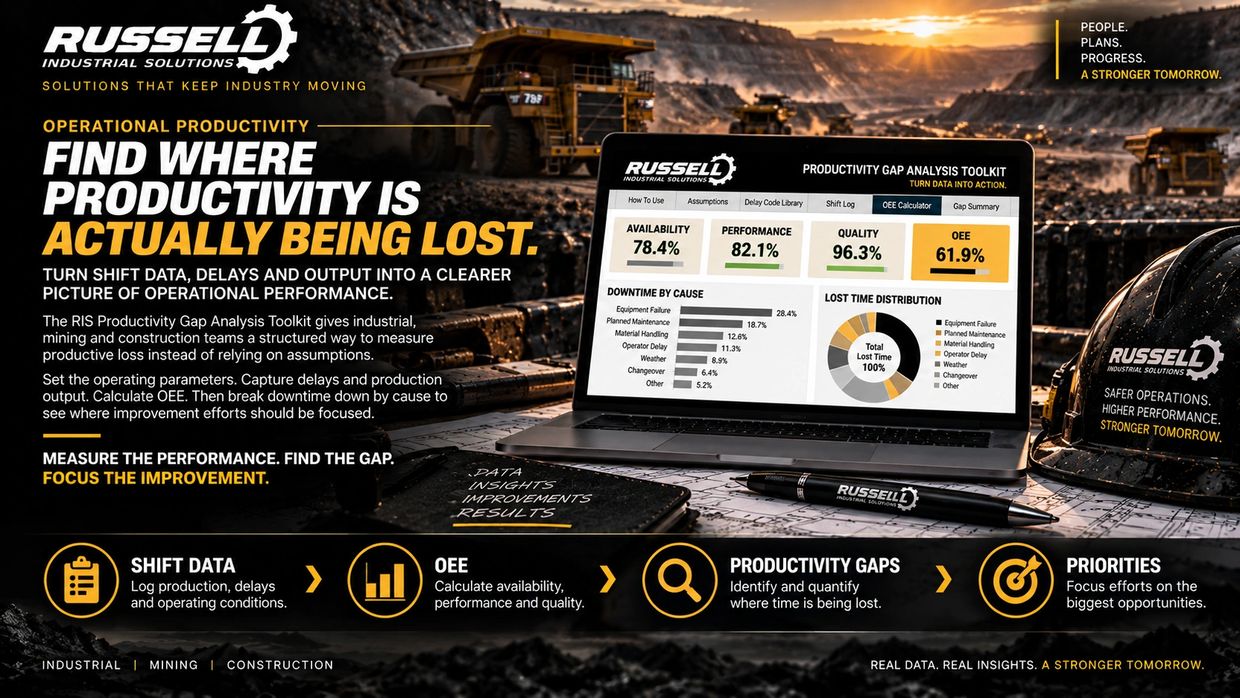
The RIS Productivity Gap Analysis Toolkit gives industrial, mining and construction teams a structured way to measure productive loss instead of relying on assumptions.
Set the operating parameters. Capture delays and production output. Calculate OEE. Then break downtime down by cause to see where improvement efforts should be focused.
MEASURE THE PERFORMANCE. FIND THE GAP. FOCUS THE IMPROVEMENT.
THE PRODUCTIVITY GAP
BEING BUSY DOESN'T MEAN THE OPERATION IS PERFORMING.
Production can be moving while productive time is quietly disappearing.
Equipment failures, planned maintenance, material handling, operator delays, weather, changeovers and other interruptions can accumulate across a shift—without any
single event looking like the real problem.
Without a consistent way to capture and categorize those losses, improvement efforts can end up focused on what gets noticed instead of what costs the operation the most productive time.
THE BIGGEST DELAY ISN'T ALWAYS THE BIGGEST GAP. MEASURE IT BEFORE YOU CHASE IT.
FROM SHIFT DATA TO PRODUCTIVITY INSIGHT
MEASURE THE LOSS. BREAK IT DOWN. FIND WHERE TO FOCUS.
01 — Set the Assumptions
01 — Set the Assumptions
01 — Set the Assumptions
Define the operating parameters the analysis will use.
02 — Capture the Shift
01 — Set the Assumptions
01 — Set the Assumptions
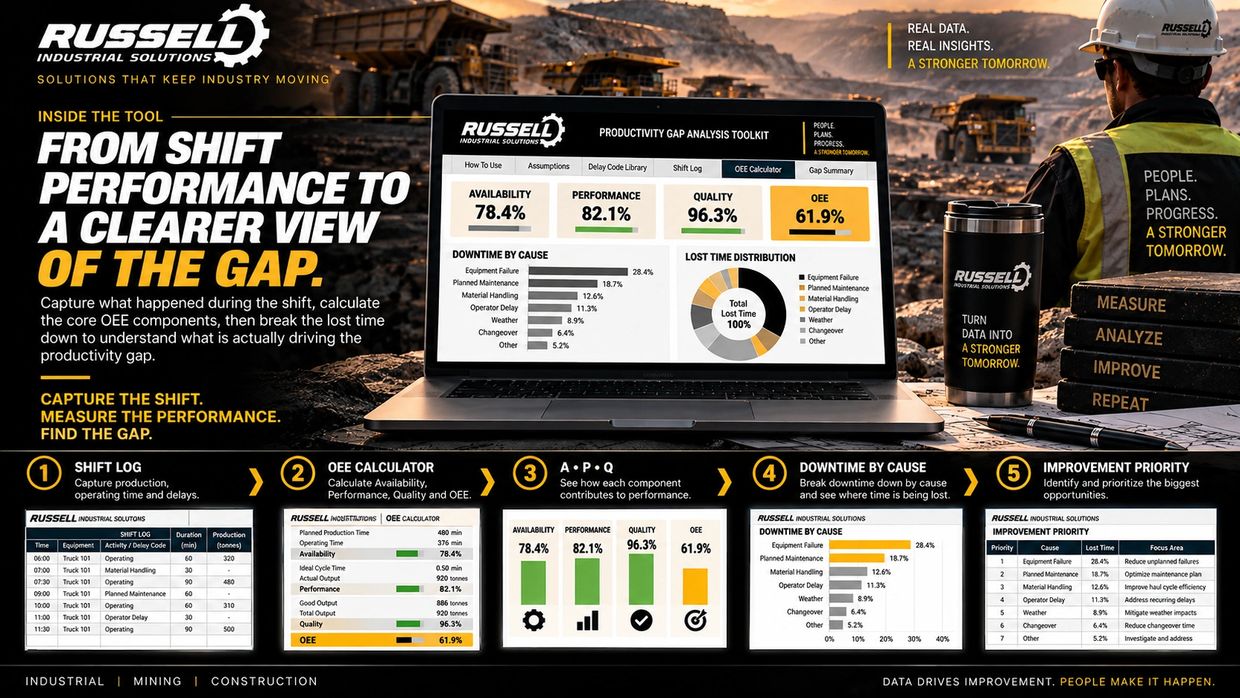
Record production, operating time and delays using consistent delay categories.
03 — Calculate OEE
04 — Analyze the Gaps
04 — Analyze the Gaps
Turn the shift data into Availability, Performance, Quality and overall OEE.
04 — Analyze the Gaps
04 — Analyze the Gaps
04 — Analyze the Gaps
Break downtime down by cause and identify where lost productive time is accumulating.
WHAT'S INSIDE
MORE THAN AN OEE CALCULATOR.
01 — Operating Assumptions
01 — Operating Assumptions
01 — Operating Assumptions
Set the baseline operating parameters used throughout the analysis.
02 — Delay Code Library
01 — Operating Assumptions
01 — Operating Assumptions
Create consistent categories for the delays and losses occurring during the shift.
03 — Shift Log
01 — Operating Assumptions
04 — OEE Calculator
Capture operating time, downtime, production output and the conditions behind the loss.
04 — OEE Calculator
04 — OEE Calculator
04 — OEE Calculator
Calculate Availability, Performance, Quality and overall OEE from the recorded shift data.
05 — Gap Summary
04 — OEE Calculator
05 — Gap Summary
Break downtime down by cause and see where lost productive time is accumulating.
BUILT FOR OPERATIONAL PERFORMANCE
FOR TEAMS THAT NEED TO KNOW WHERE PRODUCTIVE TIME IS ACTUALLY GOING.
01 — Operations & Production
02 — Supervisors & Frontline Leaders
02 — Supervisors & Frontline Leaders
Turn shift performance and production losses into information that can support better operational decisions.
02 — Supervisors & Frontline Leaders
02 — Supervisors & Frontline Leaders
02 — Supervisors & Frontline Leaders
See recurring delays and understand where lost productive time is accumulating across the shift.
03 — Continuous Improvement
04 — Maintenance & Reliability
04 — Maintenance & Reliability
Use consistent performance data to identify and prioritize improvement opportunities.
04 — Maintenance & Reliability
04 — Maintenance & Reliability
04 — Maintenance & Reliability
See how equipment-related downtime contributes to the overall productivity gap.
INDUSTRIAL. MINING. CONSTRUCTION. BUILT FOR OPERATIONS THAT WANT TO IMPROVE WHAT THE DATA ACTUALLY S
INSIDE THE TOOL
YOUR RIS TOOLKIT
EVERYTHING YOU NEED TO TURN SHIFT DATA INTO PRODUCTIVITY INSIGHT.
01 — Ready-to-Use Analysis Workbook
01 — Ready-to-Use Analysis Workbook
01 — Ready-to-Use Analysis Workbook
A structured Excel toolkit designed to move from operating inputs to measurable productivity analysis.
02 — Shift & Delay Tracking
01 — Ready-to-Use Analysis Workbook
01 — Ready-to-Use Analysis Workbook
Capture production, operating time and downtime using consistent delay categories.
03 — OEE Analysis
04 — Productivity Gap Summary
04 — Productivity Gap Summary
Calculate Availability, Performance, Quality and overall OEE from your operating data.
04 — Productivity Gap Summary
04 — Productivity Gap Summary
04 — Productivity Gap Summary
Break lost time down by cause so the biggest productivity gaps are easier to identify.
PRODUCT DETAILS
FORMAT — Microsoft Excel workbook
DELIVERY — Digital download
USE — Editable for your organization
ANALYSIS — OEE & downtime by cause
Results depend on the accuracy and consistency of the operating data entered. OEE and productivity measures should be interpreted in the context of your equipment, process and operating environment.
CAPTURE THE DATA. QUANTIFY THE LOSS. FOCUS THE IMPROVEMENT.
BUILT FOR YOUR ORGANIZATION
BUY IT ONCE. USE IT TO UNDERSTAND YOUR OPERATION.
The RIS Productivity Gap Analysis Toolkit is provided
under a single-organization internal-use license.
YOU CAN
Customize the workbook for your operation • Configure operating assumptions and delay codes • Enter and retain your own operational data • Use the analysis for internal planning and improvement activities
YOU CAN’T
Resell or redistribute the toolkit • Provide copies to other organizations • Package it into another commercial product • Claim the RIS tool or underlying structure as your own intellectual property
Need something broader?
Contact Russell Industrial Solutions for multi-organization use, consulting applications or customized deployment.
YOUR DATA. YOUR OPERATION. A CLEARER VIEW OF THE GAP.
READY TO FIND WHERE PRODUCTIVITY IS BEING LOST?
TURN OPERATING DATA INTO A CLEARER IMPROVEMENT PRIORITY.

RIS PRODUCTIVITY GAP ANALYSIS TOOLKIT
C$ 149.00

Capture shift performance. Calculate OEE. Break downtime down by cause. Identify where productive time is being lost.
Microsoft Excel • Digital Download • Single-Organization License
Digital product. Delivered electronically. No physical product will be shipped.
MEASURE THE PERFORMANCE. FIND THE GAP. FOCUS THE IMPROVEMENT.
Copyright © 2026 Russell Industrial Solutions - All Rights Reserved.
Powered by GoDaddy
This website uses cookies.
We use cookies to analyze website traffic and optimize your website experience. By accepting our use of cookies, your data will be aggregated with all other user data.